


When you’re growing with performance, the real question isn’t “how much does a lead cost?” It’s “how much can I pay to acquire a customer without breaking profitability?” That’s where CAC (Customer Acquisition Cost), LTV (Lifetime Value) and the LTV/CAC ratio come in.
This post is designed so you can use the ratio as a decision tool (budget, channel mix, optimization priorities), not as a number you report once a month.
What are CAC and LTV in marketing and digital business?
You probably already have a working idea of CAC and LTV. Still, if you want your analysis to hold under pressure, you need operational definitions that don’t collapse when the funnel changes.
What is CAC?
CAC is how much it costs you, on average, to acquire a real customer. The key nuance is the word “customer”: if you calculate CAC using an event that’s too high up the funnel (registration, install, lead), CAC looks “cheap” while you may be buying low quality or future friction.
Operational definition (to avoid breaking your model)
- Customer = the first event that enables real economic value (e.g., first deposit, first purchase, first installment paid, first transaction).
- CAC should be calculated on that value-enabling event, not on vanity metrics.
Base formula
- CAC = Total acquisition spend / Number of new customers (as defined above)
What is LTV?
LTV estimates how much economic value a customer generates during their relationship with the product. In digital products (fintech/apps), a “simple historical average” often misleads if pricing, onboarding, risk, channels, or product changed—so cohort-based views are usually the safer default.
Common ways to calculate LTV (pick one and stay consistent)
- Simple LTV: ARPU (Average Revenue Per User) × gross margin × average customer lifetime.
- Cohort LTV: cumulative value for a cohort over X months (great for comparisons and decisions).
- Segment LTV: LTV by channel/country/profile (especially important in fintech due to quality and risk).
CAC vs LTV: quick comparison
The table below summarizes the practical differences and the most common failure modes.
| Metric | What it measures | Best used for | Common pitfall |
|---|---|---|---|
| CAC | Cost to acquire a customer (based on a value event) | Budgeting, channel efficiency, scaling decisions | Defining “customer” as install/lead and underestimating true CAC |
| LTV | Economic value generated over the relationship | Unit economics, profitability, long-term planning | Using revenue instead of margin, or ignoring cohort shifts |
| LTV/CAC | Value created vs cost to acquire | Go/no-go for scaling and channel prioritization | Bad inputs (CAC or LTV) make the ratio meaningless |
What is the LTV/CAC ratio and why is it a key metric?
The LTV/CAC ratio compares the value a customer generates with what it cost to acquire them. It’s a direct thermometer of unit economics: if the relationship is healthy, you can scale; if not, you’re growing by “buying problems.”
What it helps you decide (for real)
- Whether you can scale budget without destroying margin.
- Which channels/segments pay back vs which ones inflate volume.
- Whether the core problem is acquisition efficiency (CAC) or value/retention (LTV).
What it does not solve by itself
It doesn’t tell you how fast you recover CAC. For that you need payback (months to recover CAC using contribution margin). And if CAC or LTV are mismeasured, the ratio will be wrong too.
How to interpret the LTV/CAC ratio correctly
There is no universal “magic number.” Still, ranges can help you diagnose what’s happening—only if you’re using consistent definitions.
Practical guide (with nuance)
- LTV/CAC < 1: you’re usually losing money per customer (or measuring incorrectly).
- 1 to 3: gray zone; can work if payback is short and quality is solid.
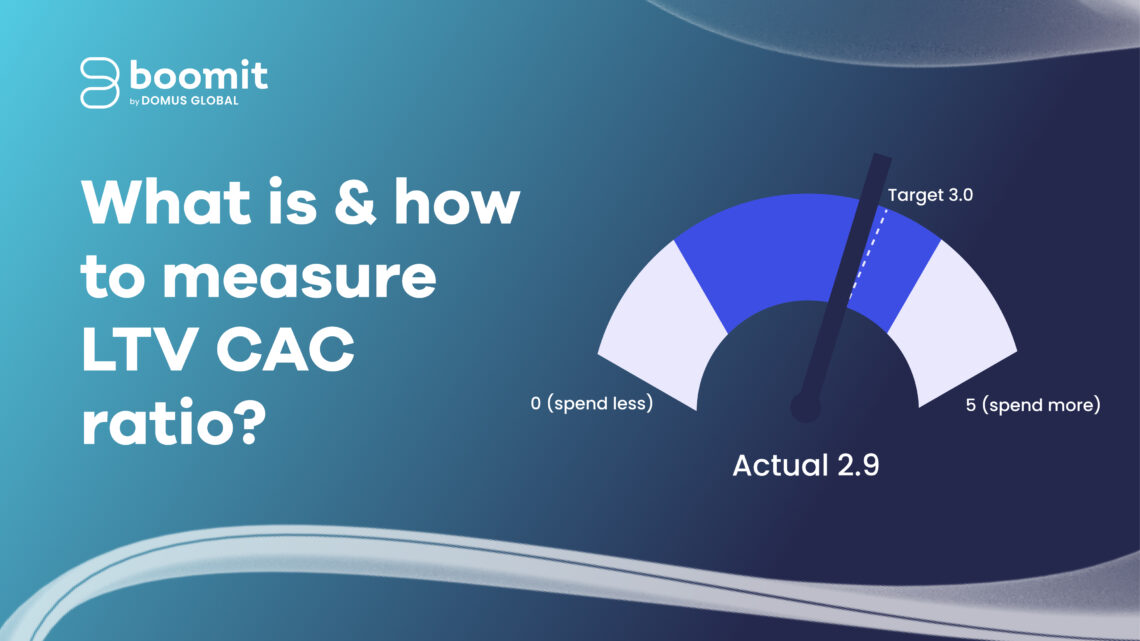
- ≈ 3: often healthy for many digital models, if LTV is well estimated.
- > 5: sounds great; audit attribution, margins, and time windows—or it may signal under-investment.
How growth teams should read it step by step
- Align definitions: what is “customer,” which costs are included in CAC, which time window is used for LTV.
- Split by channel and segment: the global average hides opposite realities.
- Add payback: a “good” ratio with long payback can choke cash flow.
- Return to the funnel: if the ratio drops, find whether the driver is CAC (CPM (cost per thousand impressions) / CVR (conversion rate)) or LTV (churn, activation, monetization).
Fast interpretation
- LTV/CAC < 1 → “I’m buying loss” (or measuring wrong).
- 1–3 → “I need to refine: payback + quality by channel.”
- ~3 → “Healthy baseline to scale with control.”
- >5 → “Audit measurement or evaluate under-investment.”
Common mistakes when analyzing CAC vs LTV (and how to avoid them)
If you want CAC and LTV to guide decisions, there are traps that change everything. Here are the most frequent ones and how to prevent them.
Typical errors
- Using revenue instead of margin: LTV without margin inflates the ratio.
- Mixing windows: 30-day CAC vs 24-month LTV without a solid basis.
- Ignoring cohorts: LTV shifts when product, pricing, or traffic mix changes.
- Inconsistent attribution: duplicated conversions or events not aligned across ads, analytics, and backend.
- Averaging everything: a global “OK” ratio can hide a channel that drains cash.
- Ignoring quality/risk (fintech-specific): apparent LTV can collapse with delinquency, fraud, or chargebacks if not incorporated.
How to avoid them (4 rules)
- LTV always with margin and an explicit time window.
- Ratio always by cohorts and by channel/segment.
- Measurement: consistent events across platform, analytics, and backend.
- Investment decisions: ratio + payback + quality signals.
How to improve the LTV/CAC ratio from marketing
You improve the ratio in two ways: reduce CAC and/or increase LTV. The key is not to “optimize what’s easiest to measure” while ignoring what moves the business.
Levers to reduce CAC (without killing growth)
Reducing CAC in fintech (or any category) isn’t “spending less.” It’s buying better customers at the same cost—or the same customer at lower cost—by improving conversion and optimization signals.
- Optimize to the right event: campaigns should optimize to a real customer value event, not registrations.
- Improve funnel CVR (conversion rate): landing → onboarding → activation.
- Creative with a method: new angles, formats, and proof points to reduce fatigue.
- Quality-first targeting: exclude low-intent audiences or segments with early churn.
- Channel mix: balance intent (search), reach (social), and retention (CRM (Customer Relationship Management)).
Levers to increase LTV (marketing does impact LTV)
In digital products, marketing influences LTV because it can accelerate activation, reinforce habits, and improve monetization with better timing.
- Activation: drive “first real value” within 24–72 hours using CRM and in-app messages.
- Retention: behavior-based campaigns (reactivation, education, useful reminders).
- Monetization: cross-sell/upsell based on signals (not calendars).
- Quality: in fintech, acquiring profiles that truly fit reduces churn and risk.
Actions → effect → guiding metric
Use this as a quick map to connect marketing actions to what you should measure.
| Action | Expected effect | Guiding metric |
|---|---|---|
| Optimize to a value event (first deposit/first purchase) | Higher customer quality, lower wasted spend | CAC to value event, downstream CVR |
| Improve onboarding and activation | More customers reach first value faster | D1/D7 activation rate, time-to-first-value |
| Weekly creative testing (angles/formats/proof) | Lower CPM and higher CVR | CTR (click-through rate), CVR, CAC trend |
| Behavioral CRM sequences | Better retention and repeat usage | Retention (D7/D30), churn rate |
| Signal-based cross-sell/upsell | Higher monetization per customer | ARPU, contribution margin per cohort |
How we do it at Boomit
For us, the ratio works when you turn it into a weekly decision system. First we fix definitions and measurement: what “customer” means, which early value events matter, and how ads, product, and data connect to read cohorts without noise. Then we align performance objectives to real value events and run an experimentation loop where creative and data work together.
Our method
- Data + measurement: events, cohorts, margin, and payback visible in an operational dashboard.
- Performance: structure by intent and stage (prospecting/retargeting/CRM), optimizing to real value.
- Performance content: backlog of angles/formats, weekly tests, and a learning agenda.
- Iteration: every week we answer “what increased CAC / what reduced LTV / what experiment attacks it.”
Actionable checklist
Definitions
- Define “customer” as an event that enables real revenue (not lead/install).
- Make CAC include all acquisition costs you’re actually paying (media + fees where relevant).
Measurement
- Calculate CAC by channel + cohort + segment.
- LTV includes margin and an explicit time window.
- You have LTV/CAC by channel (not just the total).
- Run a minimum attribution and event-consistency audit.
Decision system
- Measure payback (months) and use it to decide budget.
- Keep 3–5 active experiments targeting the main driver (CAC or LTV).
Conclusion: optimize your CAC vs LTV analysis
The LTV/CAC ratio is useful when it stops being a reporting KPI (Key Performance Indicator) and becomes an investment decision tool. If you measure it with margin, by cohorts, and with payback, you can scale with control, identify channels that don’t pay back, and prioritize optimizations that move the business.
If you want, Boomit can help you build the full system (data + performance + creative) to measure and improve your LTV/CAC ratio and turn CAC and LTV into a profitable growth lever.


