


Investing in campaigns without a web analytics tool stack is like scaling budget with the dashboard turned off. You see results (sometimes), but you don’t understand why they happen or which levers to pull.
In addition, data analytics in the financial sector adds an extra challenge: privacy, consent, imperfect attribution, and the need for quality signals (not just volume).
In this article you’ll see what these tools are, what types exist, which ones are most used in digital marketing, and how to choose them based on the analysis you need.
What are web analytics tools and what are they for?
Web analytics tools are platforms that collect, organize, and analyze behavioral data on web (and often app) to make growth decisions. Their value isn’t “measuring visits,” but answering operational questions like:
- Which channel brings users who activate and convert—not just click?
- Where does the funnel break on a landing page or during onboarding?
- Which creatives and messages generate real intent, and which ones inflate metrics?
- Which segments have a better projected LTV (lifetime value)?
In practice, the goal is to optimize investment, experience, and conversions with evidence (not intuition).
Types of web analytics tools you should know
There are six families that cover almost all performance needs:
- Traffic and event analytics: what arrives, what it does, what converts.
- Tag management: governance of tags and events.
- Behavior analytics / UX: why users get stuck (scroll, clicks, recordings).
- Product analytics: event-based funnels, cohorts, retention.
- BI / reporting: unify sources (Ads + CRM + product + payments).
- Privacy-first: data control, hosting, compliance.
This classification helps you choose by business question, not popularity.
Most used web analytics tools in digital marketing
Below are widely used tools and the type of analysis they support.
Google Analytics 4 (GA4)
GA4 measures acquisition, behavior, and conversions with an event-based model. It’s a good default for visibility into channels, pages, and overall performance.
Google Tag Manager (GTM)
GTM lets you manage pixels, tags, and events without always depending on engineering. It’s key to keep measurement consistent when you iterate on landings and creatives week after week.
Data Studio / BI (Looker, Power BI)
When you need executive decisions—CAC (customer acquisition cost), ROAS (return on ad spend), revenue, cohorts—a BI layer is where you unify Ads + analytics + CRM + product/payment data. This is where the “source of truth” lives.
Hotjar / Contentsquare (behavior analytics)
These tools tell you why a user doesn’t convert: heatmaps, recordings, UX funnels. They’re ideal for optimizing landing pages, forms, and critical flows.
Mixpanel (product analytics)
Mixpanel is strong for product: event funnels, cohorts, retention, and behavior-based segmentation. Useful when conversion depends on activation inside the experience (not only the landing page).
Matomo (privacy-first)
Matomo is used when you need control and alternatives to GA4 (privacy, hosting, or internal policies). It’s common in contexts with sensitive data.
Comparison table
Below is a compact comparison to help you choose quickly.
| Tool | Best for | Analysis type | When it’s a fit |
|---|---|---|---|
| GA4 | Overall performance view | Traffic, events, conversions | Base stack + standard reporting |
| GTM | Implementation and control | Tags, pixels, events | Fast iteration on campaigns/landings |
| Looker Studio / BI | Executive decisions | Source unification | When Ads ≠ business (payments, CRM) |
| Hotjar / Contentsquare | Friction and UX | Heatmaps, sessions, UX funnels | Improve CVR (conversion rate) |
| Mixpanel | Activation/retention | Event funnels, cohorts | Product with complex onboarding |
| Matomo | Privacy | More controlled analytics | Compliance requirements |
How we do it at Boomit
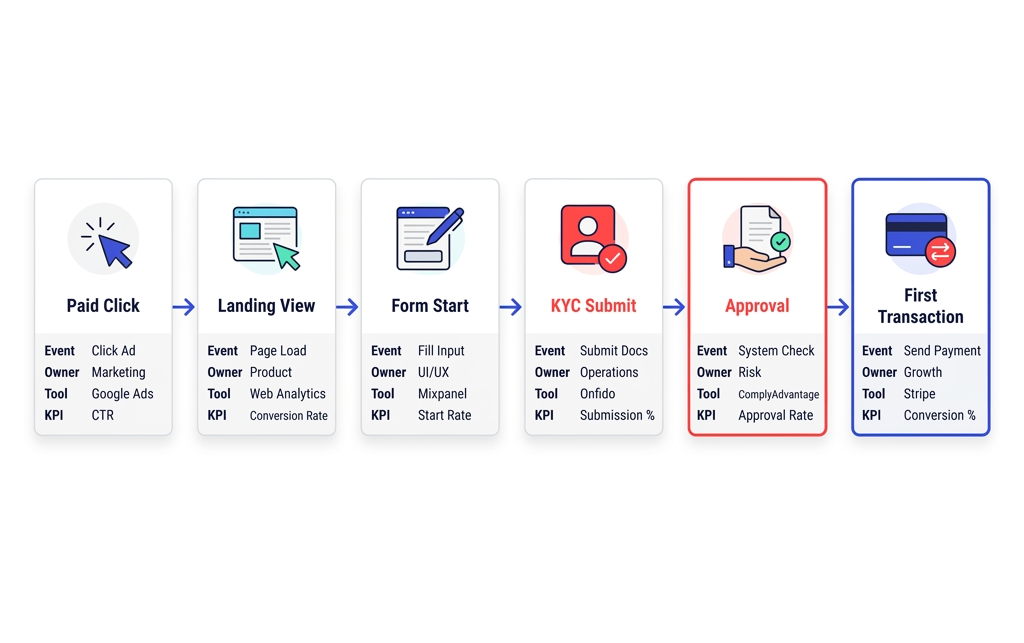
At Boomit, we use the BOOM Model (Business–Observability–Optimization–Measurement) so data actually impacts performance:
- Business: we define 1–2 value events (e.g., verified signup, completed KYC, first deposit).
- Observability: we instrument events and properties (source, campaign, intent, score).
- Optimization: we connect signals to paid decisions (audiences, bidding, creatives, landings).
- Measurement: we consolidate in BI and review weekly with clear hypotheses.
At each step of the funnel we define: event, owner, tool and KPI (key performance indicators).
Common mistakes / What to avoid
- Measuring only clicks/installs and optimizing for volume, not quality signals.
- Events without definition (different names, incomplete properties, double counting).
- Dashboards without decisions: reporting without “what would we do differently” per metric.
- Not separating UX from channel: blaming Ads when the bottleneck is forms/KYC.
Actionable checklist
Instrumentation
- Conversion event defined (what, when, who).
- Consistent naming and minimum properties (channel, campaign, segment).
Funnel
- End-to-end funnel (landing → activation → monetization).
- Drop-off points prioritized by impact.
Paid
- Optimization goal aligned with a value event.
- Audiences and creatives tagged for learning.
Creative
- Angle-based hypotheses + A/B test with a clear criterion.
- Message consistent with the landing page.
Business
- BI combining Ads + product + revenue/payments.
- Weekly review: insight → action → result.
Conclusion
Web analytics tools aren’t chosen because they’re trendy—they’re chosen based on the question you need to answer and the decision you need to make. In financial-sector data analytics, winning usually depends on instrumenting well, attributing with judgment, and optimizing with quality signals.
If you want, we can help you define your minimum stack and turn it into real campaign optimization through our Web Analytics Agency.


