

A fintech can attract thousands of sign-ups and still struggle to grow: some people open an account, try the product, and stop using it. Churn rate measures that loss. Understanding it helps identify where the customer relationship breaks down and whether the investment in acquisition is generating sustainable growth.
What is churn rate and why does it matter?
Churn rate is the percentage of customers who stop using a product or service during a given period. In a subscription business, it may reflect cancellations; in a financial app, it requires defining what it means to become inactive—for example, not completing a transaction for a certain amount of time.
That definition should reflect how the product is actually used. A wallet designed for everyday payments and an investment platform should not automatically apply the same inactivity threshold.
This metric matters because acquiring customers has a cost. If a large share leaves before using the product regularly, new sign-ups can hide a growth problem. Churn should also be analyzed alongside activation, usage frequency, and the value generated by each customer group.
Churn rate vs. retention rate
| Metric | Question it answers | Example with 1,000 initial customers |
|---|---|---|
| Churn rate | What percentage of the initial customers was lost? | If 80 left, churn is 8%. |
| Retention rate | What percentage of the initial customers remained? | If 920 remained, retention is 92%. |
When both metrics use the same group, period, and activity criteria, they add up to 100%. If retention is calculated for a specific cohort (a group of users who share a starting point, such as the month they opened their accounts) and churn is calculated for the entire customer base, that equivalence is no longer a valid comparison.
How do you calculate churn rate?
The basic formula for measuring customer churn is:
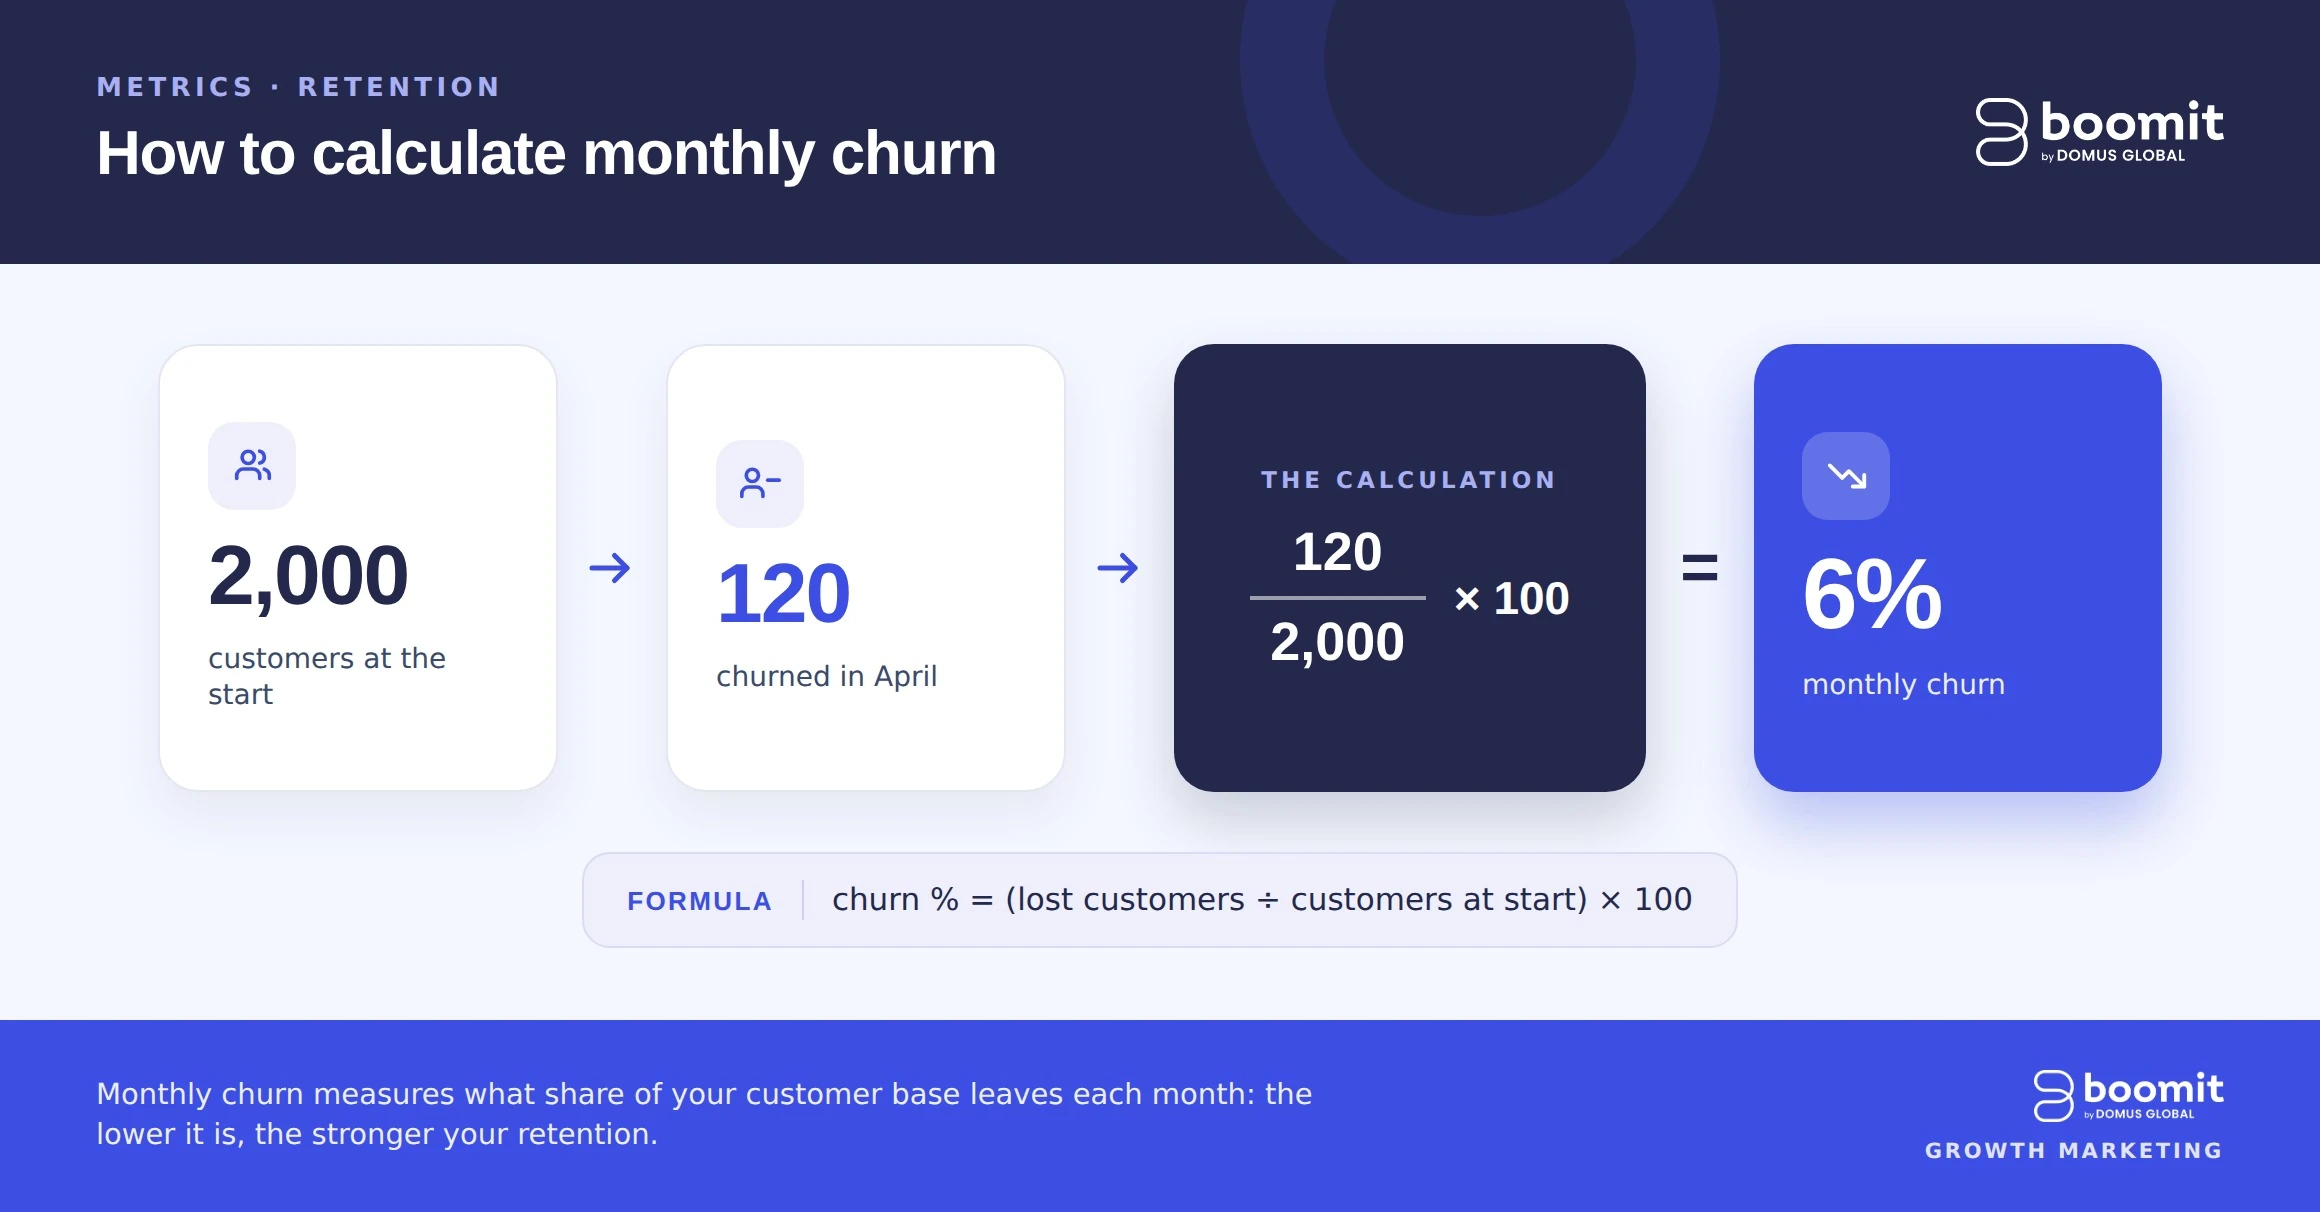
Churn rate = (customers lost during the period ÷ active customers at the start of the period) × 100
Suppose an app started April with 2,000 active customers. During that month, 120 stopped meeting the defined activity criteria. Its monthly churn rate was therefore 6%:
(120 ÷ 2,000) × 100 = 6% monthly churn.
Notice that new customers acquired during April are not included in the calculation. They are not added to the denominator because they were not part of the initial customer base whose losses we are measuring. Simply subtracting the end-of-month customer count from the starting count is also insufficient, because new sign-ups could offset and conceal churn. Using the active customer base at the start of the period is consistent with the documented methodology for subscriptions, making it a useful starting point.
For the calculation to be useful, always document three decisions: what counts as an active customer, when a customer is considered lost, and the analysis period. If these rules change, comparisons with previous months can be misleading.
How should you interpret a company’s churn rate?
A standalone figure of 6% tells you little. Its meaning depends on expected usage frequency, the purchase cycle, product maturity, and customer type. In a monthly subscription, cancellation is usually observable. In an app without a contract, inactivity may be temporary. That is why mobile apps and subscription products cannot always be compared directly.
The first useful comparison is with the company’s own performance over time, keeping measurement rules consistent. Then segment the customer base by country, product, plan, acquisition date, and acquisition channel.
| What you observe | What to investigate |
|---|---|
| High churn shortly after registration | Whether users understand the product and reach their first valuable action. |
| Churn concentrated in one advertising channel | Whether the campaign attracts people with a need different from the one the product addresses. |
| Churn after the first use | Whether there is friction when repeating the transaction or finding a second reason to use the product. |
In a fintech, that first valuable action could be funding an account or completing a payment, depending on the product. Registration alone does not show that the customer has received value. One clear example for us was our work with Banpaís, which came to us needing to attract users with the capacity to make an initial savings deposit. For us, this meant developing a strategy focused on acquiring users who would meet the initial requirements and continue to meet them over time.
How can you reduce churn rate and retain more customers?
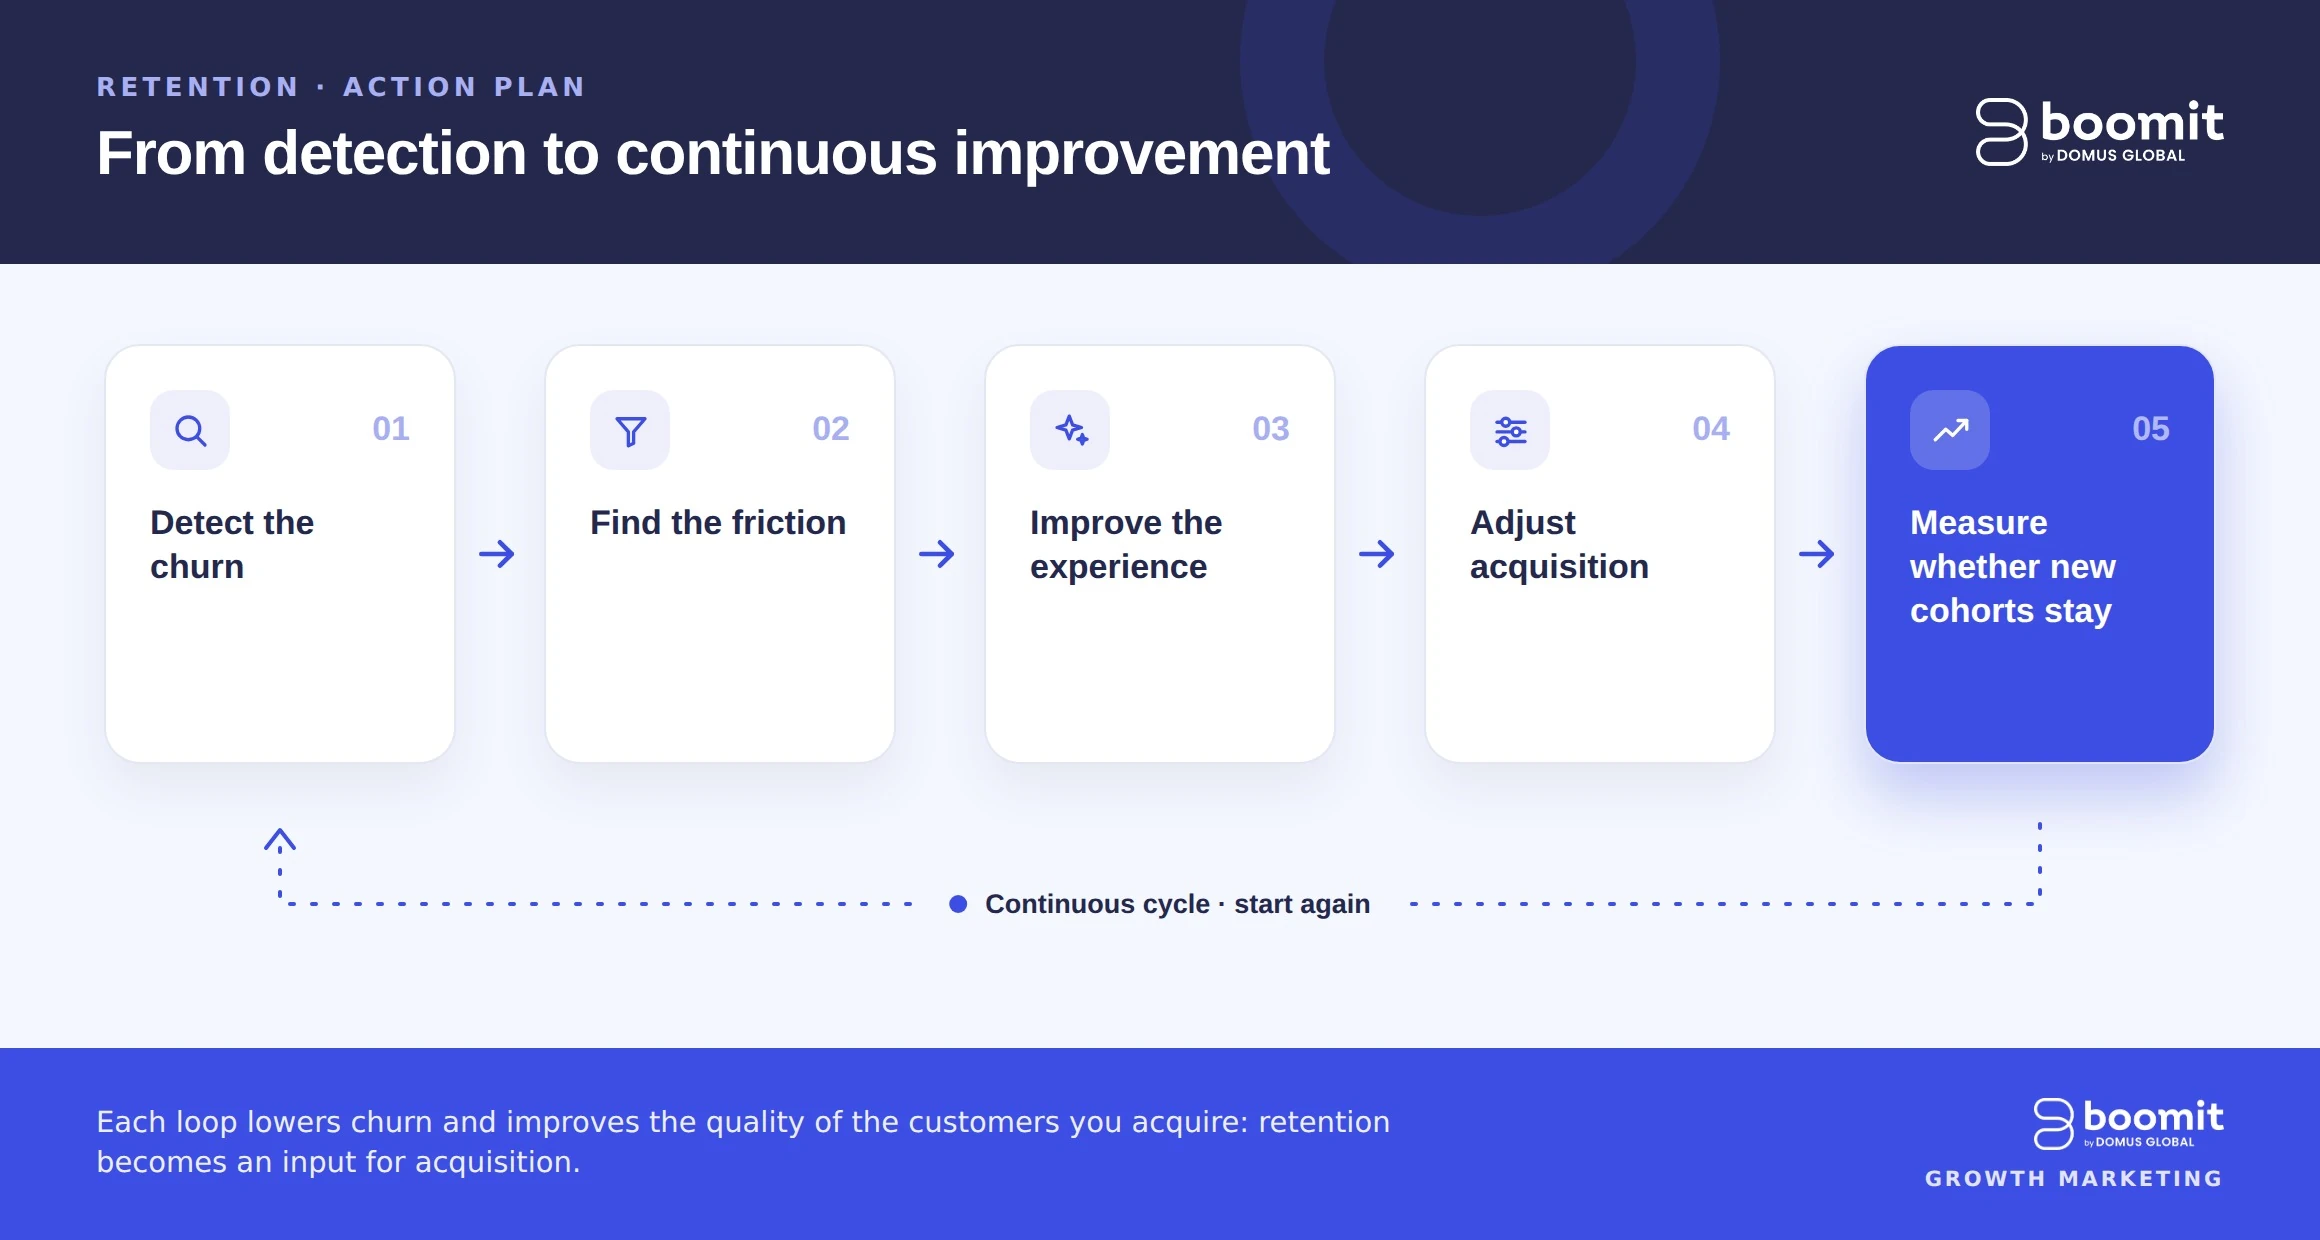
Reducing churn requires understanding when it happens and what experience precedes it. These actions provide a starting point and are a major part of the methodology we use at Boomit with Banpaís and our other clients:
- Identify when customers leave. Measure how many users move from registration to the first valuable action and how many return to transact again.
- Investigate friction. Review usage data, support inquiries, and customer feedback. A verification issue, a poorly communicated expectation, or a confusing step can cause churn for different reasons.
- Improve the first experience. Explain the next step clearly and remove obstacles that prevent users from completing the action they came for.
- Communicate based on behavior. A useful reminder for someone who did not complete registration should differ from a message for someone who has already transacted and then become inactive.
- Review whom your campaigns attract. Compare acquisition sources and ads based on activation and subsequent usage, as well as the cost of generating a sign-up.
This last measurement prevents a campaign from being credited with an improvement simply because it brought in more users. In app marketing strategies, connecting acquisition data with what happens inside the app makes it possible to assess the quality of those users after installation.
How we do it at Boomit
At Boomit, we consider four different signals that are key to connecting growth with continued customer activity:
Acquisition source → Activation → Second use → Continued activity.
First, we identify the campaigns and messages that bring users in. Then we observe who completes the action that demonstrates real interest, who returns, and which groups remain active over the period relevant to the business.
This is how we bring together data, creativity, and performance marketing: data shows which groups remain active; creativity aligns the ad’s promise with the experience the user will find; and advertising strategy prioritizes sources that bring in customers more likely to use the product. A campaign can then be evaluated by the customer base it helps build, as well as the sign-ups it generates.
Common mistakes: what to avoid
The most common mistake is celebrating a drop in cost per sign-up without checking what happens afterward. Mixing free users and paying customers, comparing monthly rates with annual rates, or changing the definition of “active” midway through a time series can also distort the analysis.
Another mistake is treating all churn as a communication problem. If users leave because of product friction, more messages may increase interactions without addressing the cause.
Conclusion: reduce churn rate with a Boomit growth marketing strategy
Churn rate shows how many customers you lose, but its value emerges when it helps you understand why they leave and what you can change. Measuring it alongside activation and acquisition sources helps improve the experience and invest in audiences with greater potential to remain active.
If you want to connect these signals with your campaigns and growth decisions, explore how we work at our Growth Marketing Agency for Fintech.